Mapping transparency in ggplot2 to a continuous variable
(...or my debugging efforts for ggplot2)
By Andrea Rau in Tips and tricks
August 3, 2018
tl;dr: Use I() to treat a numeric variable in a data.frame “as is” and avoid unintended conversion when mapping to transparency in a ggplot2 aesthetic.
Today I ran into a ggplot2 plotting problem involving mapping the transparency aesthetic to a numeric variable – this drove me crazy until I figured it out.
Here’s the basic set-up: I wanted to plot a scatterplot of two variables, but have the transparency of the points be controlled by a third (numeric) variable. I also happened to be using programmatic aesthetic mappings (aes_string) rather than non-standard evaluation of aesthetics (aes), so it took me a while to figure out whether the problem was related to this (it wasn’t).
As an example, consider the mpg fuel economy data that is shipped as part of the ggplot2 package. In order to play around with it, I’m going to add a few new numeric variables called alpha_random, alpha_small, and alpha_big. So when mapping transparency to each of them, I should get variably transparent points, extremely transparent points, and totally opaque points, respectively.
library(tidyverse)
library(cowplot)
theme_set(theme_bw())
data(mpg)
mpg <- mpg %>% mutate(alpha_random = runif(nrow(mpg)),
                      alpha_small = 0.01,
                      alpha_big = 1)
Next, a simple scatterplot between cty and hwy where I map the transparency to the alpha_random.
ggplot(mpg, aes(cty, hwy, alpha=alpha_random)) +
  geom_point()
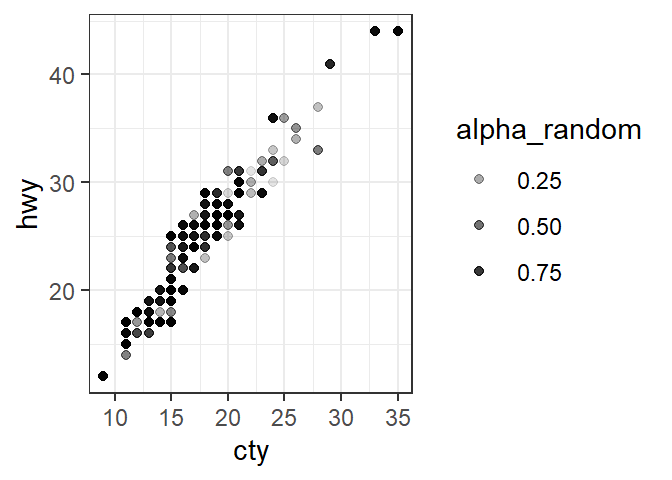
So this seems strange – my alpha_random variable appears to have been converted to a 3-level factor (as can be seen by the automatically generated legend to the right). But I thought alpha_random was numeric?
class(mpg$alpha_random)
## [1] "numeric"
What if I force it to be numeric in my ggplot2 call?
ggplot(mpg, aes(cty, hwy, alpha=as.numeric(alpha_random))) +
  geom_point()
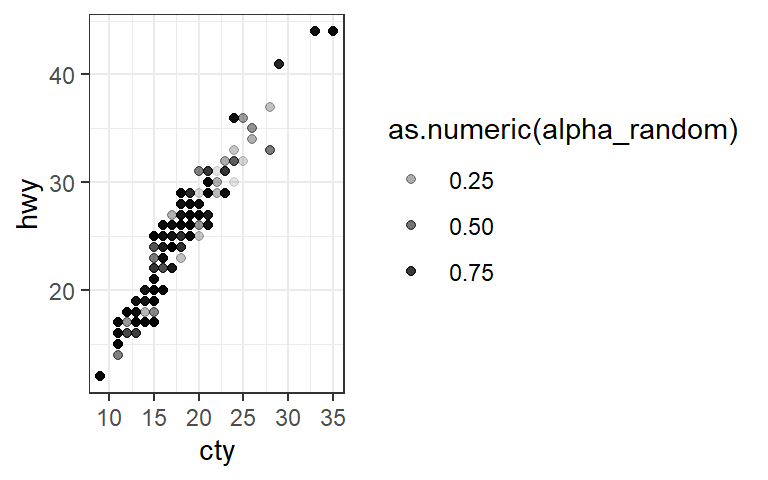
Weird – no change. Let’s see what happens when I use one of the other transparency variables I created.
g1 <- ggplot(mpg, aes(cty, hwy, alpha=alpha_small)) +
  geom_point()
g2 <- ggplot(mpg, aes(cty, hwy, alpha=alpha_big)) +
  geom_point()
plot_grid(g1, g2)
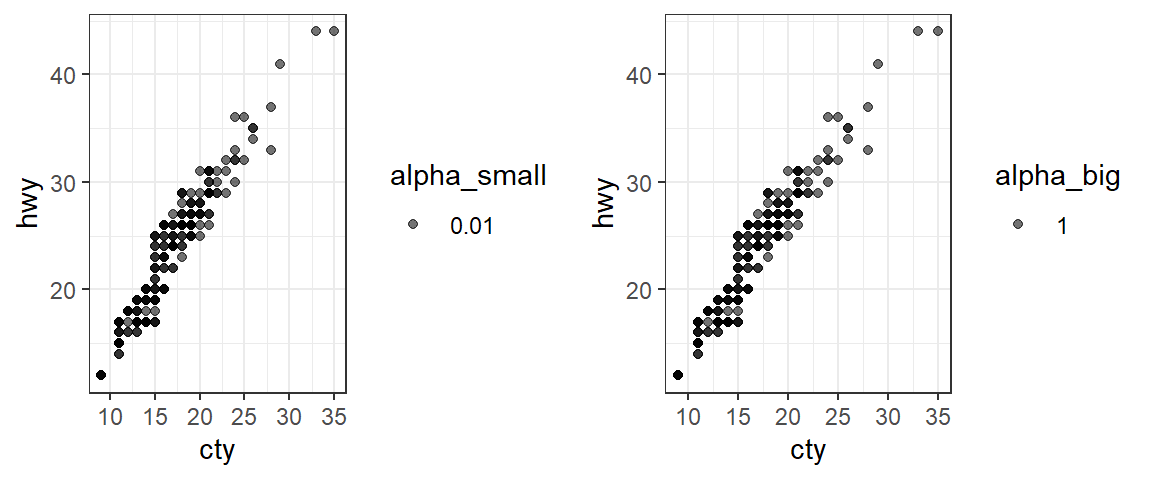
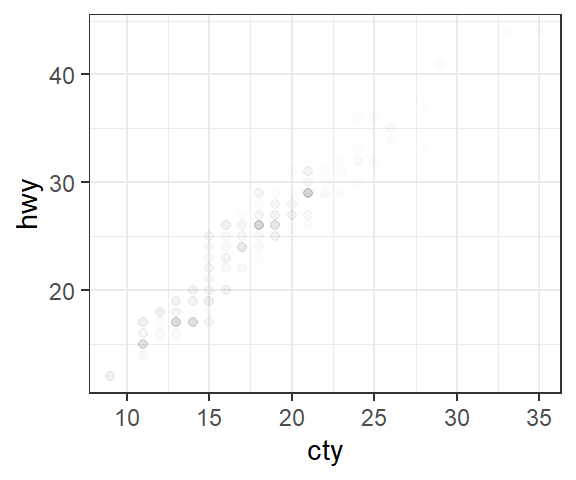
Very weird – they look exactly the same (and the same as before!), and there is still variable transparency being plotted, even though alpha_small and alpha_big are both constants. What is going on here?!? Transparency seems to work if it’s specified outside of the aesthetic as a constant:
ggplot(mpg, aes(cty, hwy)) +
  geom_point(alpha=0.01)
After some desparate Googling, I finally figured out that I needed to be using the I() function to change the class of my transparency variable to indicate that it should be treated “as is”. (Note: given its short name, this was not an easy function to Google help for, btw!)
mpg <- mpg %>%
  mutate(alpha_small = I(alpha_small),
         alpha_big = I(alpha_big),
         alpha_random = I(alpha_random))
g3 <- ggplot(mpg, aes(cty, hwy, alpha=alpha_small)) +
  geom_point()
g4 <- ggplot(mpg, aes(cty, hwy, alpha=alpha_big)) +
  geom_point()
g5 <- ggplot(mpg, aes(cty, hwy, alpha=alpha_random)) +
  geom_point()
plot_grid(g3, g4, g5, nrow=1)
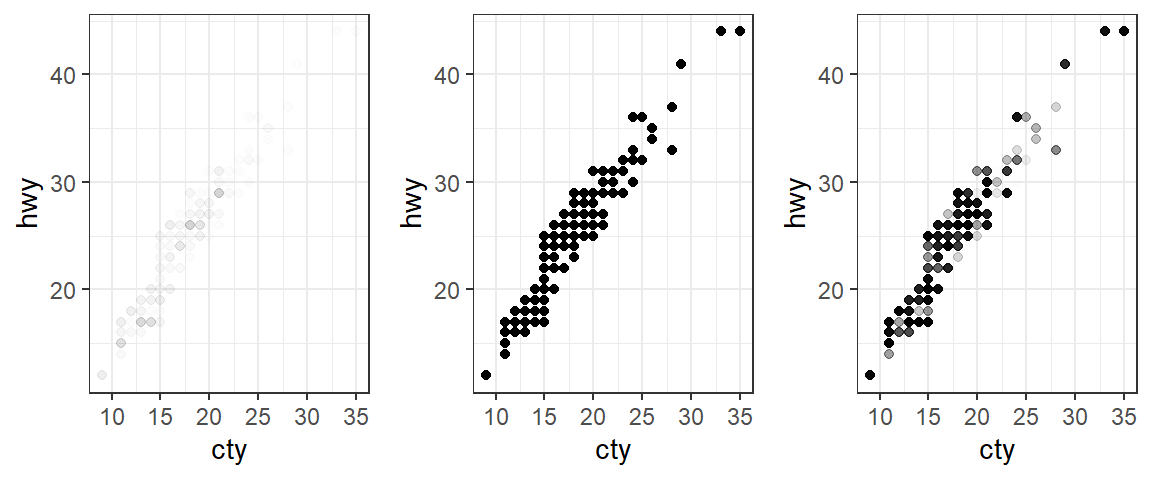
Much better – exactly what I was looking for! So the solution to my problem was making sure to change the class of the numeric variable in the data.frame to be used for transparency using I() to protect it from conversion.